Skip to Content
The Solution
The Solution

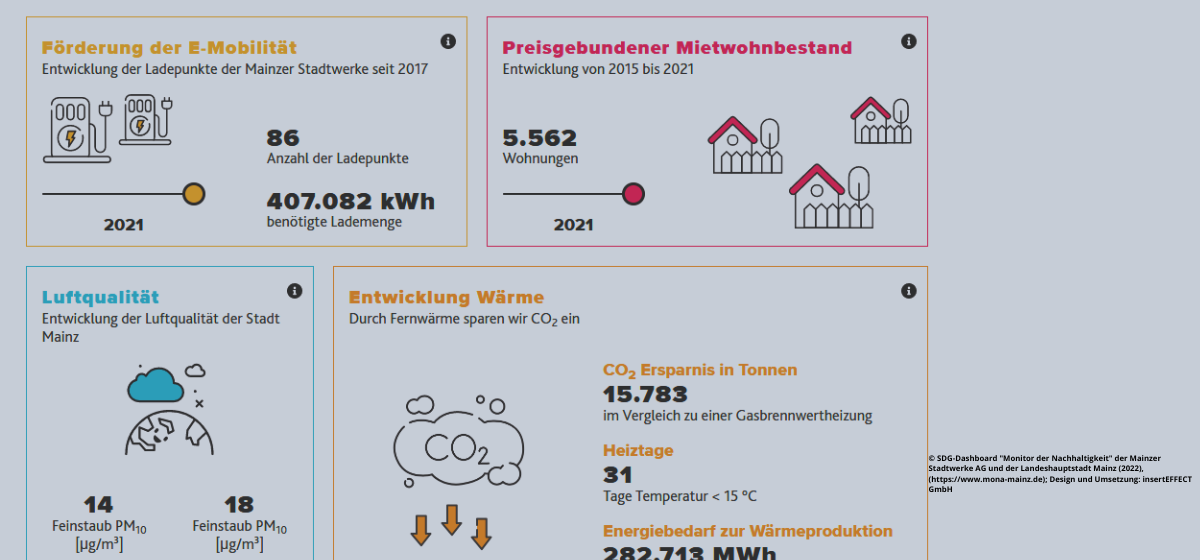
A dashboard for visualizing Sustainable Development Goals (SDGs)

Daten
Data
Umwelt
Environment

SDG dashboard

SDG dashboards are able to easily visualize different sustainability goals. Environmental data such as temperature, precipitation or air quality can be displayed in real time. Other sustainability indicators can also be added to the dashboard (even by hand, when necessary). These include data about resource consumption and social indicators such as employment rates or rental prices. Behind the dashboard is a data platform that processes real-time and static data and uses this data to create forecasts and projections. An SDG dashboard provides municipalities with a clear picture of the status of their sustainability goals and can be used in a myriad of ways - for example, providing reliable access to the public or as an internal management tool for the effective administration and implmentation of sustainability measures.

How do SDG dashboards help with sustainability?

  • Information on local SDG-relevant data can be understood at a glance
  • Sustainable and climate-conscious actions are promoted
  • Transparency increases responsible action by the administration
  • Comparability with other regions is increased
  • The effectiveness of measures can be monitored
  • Increasing the visibility of the SDG dashboard components makes taking sustainable actions more accessible
  • Creates a common reference point users can use to talk about local sustainability issues
  • Climate-damaging processes can be made visible

Requirements: What is needed for SDG dashboards?

  • Data on environmental indicators (air, water, etc.)
  • Data on social sustainability indicators (employment rate, rental prices, etc.)
  • Up-to-date, locally collected data to increase informative value
  • Forecasts to improve the informative value and specificity of dashboards
  • Stakeholder inclusion (energy providers, mobility providers, experts, citizens)
  • Expert identification of relevant data sets

Our rating:

The dashboard can create connections between different actors while serving as an effective steering tool for possible municipal sustainability measures. Much of the data needed for a simple SDG dashboard is often already available to cities. For more in-depth analyses, experts should be involved to design and present forecasts.

Which SDGS are addressed?

In order to create globally sustainable structures, the member states of the United Nations have set themselves 17 goals by 2030, which are set out in the 2030 Agenda for Sustainable Development.

image description
image description
image description
image description

Matching applications

Available applications for this solution can be found here:

Luftqualität

Die Einhaltung bestimmter Emissionsgrenzwerte, v.a. im Bereich der Luftqualität. Hier hat in den letzten Jahren insbesondere der Feinstaub eine große Rolle gespielt.

Bürgerportal für Luftqualität

Breeze Technologies stellt ein städteübergreifendes Luftqualitätsportal zur Verfügung. Städte können ihre Luftqualitätsdaten dort einstellen, um die Bevölkerung zu informieren und einzubinden.

Lärmerfassung

Das Lärmerfassungs-Paket unterstützt Sie, Ihre Bürgerinnen und Bürger sowie die Tierwelt zu schützen und hierzu notwendige Informationen für die Erstellung von Lärmaktionsplänen bereitzustellen.
Previous
Next
image description

Associated challenge(s)

(The) Challenge(s) that can be overcome with the help of this solution.
image description

Establish Municipal Climate Protection Management

  • 5 Solution(s)
  • 3 Datasource(s)
Previous
Next

Matching data(sources)

Obtain data(sources) for this solution here:

image description

Open Weather Map API

image description

Air quality data Hawa Dawa

image description

Air quality data from Breeze Technologies

Previous
Next
Back to top