The Realization
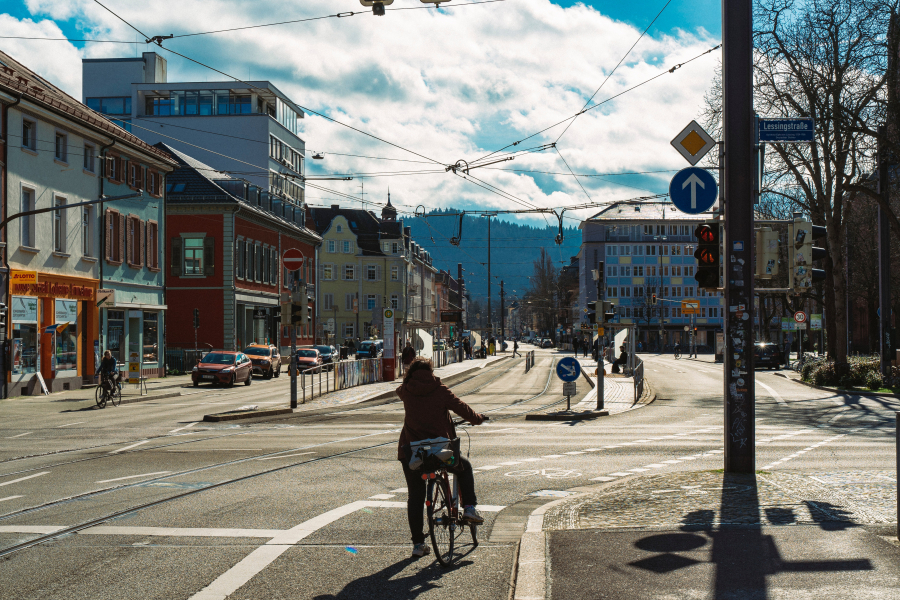
Freiburg - Live traffic visualization


Freiburg - Live traffic visualization
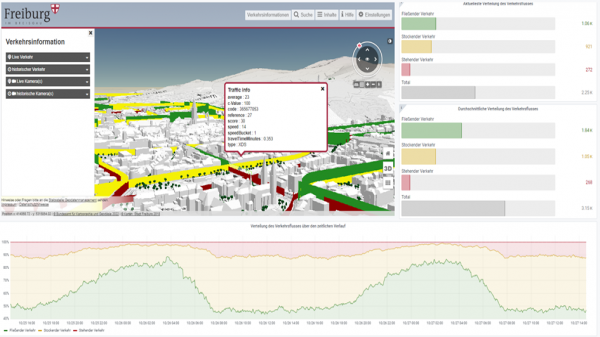
The core of the realization was the visualisation of live traffic data as a web application, which was prototypically implemented in the last project phase. The focus was on the area-wide live display of car traffic flow and bicycle traffic as well as the display of corresponding data from camera images. In addition to the live display, the historical display of the data is also possible, which allows the depiction of individual points in time and intervals.
In addition, a long-term operating concept was developed for the solution. This includes (cloud) infrastructure requirements as well as personnel requirements that are necessary for the independent operation of the solution in a production environment.
Opportunities
- Identification of challenges in traffic control.
- Easy visualization, reconstruction and (real-time) monitoring of traffic conditions.
- Outlook: people-friendly, evidence-based planning and expansion of traffic, especially bicycle infrastructure
ADAPTION FOR YOUR CITY
- This application can be obtained via the Urban Data Community
- Implementation time: 14 days
- Required: VC Map, DKSR OUP, Floating Car Data incl. mapping
Necessary technologies
- Floating Car Data (in this case from INRIX)
- Cameras (Flir)
Factor money
- The application can be adapted for use in different locations with little effort.
- UDC members with an open urban data platform can expect about 5 days of effort.
- The investment includes the connection of different data sets, the calculation logic (data model) and the visualization of the data in a dashboard.
- The largest cost factor is the connection of the data.
Lessons learned
Live visualization of traffic is more difficult for certain areas of a city, as well as for certain modes of transportation, than for others. For example, floating car data provides better data in more heavily trafficked areas of the city, but less data is available in areas with less traffic. Bicycle traffic data continues to be a challenge; here, camera footage and historical GPS data can help improve the data situation.
A technology mix of sensors, floating car data, and camera imagery provides the best foundation for traffic visualization. Care must be taken in interpreting this data due to the complexity of the data.
To enable the exploration of data through visualization, the individual elements and functions of such a visualization should be brought closer to the user by explanatory text elements to avoid misinterpretations.
Which SDGS are addressed?
In order to create globally sustainable structures, the member states of the United Nations have set themselves 17 goals by 2030, which are set out in the 2030 Agenda for Sustainable Development.


ADOPT REALIZATION
The source code of this implementation is available for free adaptation for members of the Urban Data Community. As a member, you can access the Urban Data Community's shared GitHub repository directly by clicking the button. If you have any trouble accessing the code, please contact us.
Matching data(sources)
These data(sources) provide important information for a successful realization.
FURTHER INFORMATION
You need support in adapting the application for your city? You would like to know what you have to pay attention to during the implementation? You would like to adopt the application but are not yet a community member? Contact the experts who are responsible for the implementation. We will be happy to assist you!